Tanzania’s exports of goods and services grew 16.5% to USD 19,985.8 million in the year ending July 2026, driven by gold and manufactured goods, according to the Bank of Tanzania (BOT) Monthly Economic Review for August 2026.
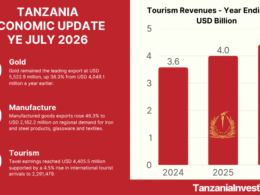
Gold exports rose 37.4% to USD 5,670.7 million, accounting for 47.4% of goods export earnings.
Headline inflation edged up to 4.2% in July 2026 on the pass-through of fuel prices to transport costs.

The Monetary Policy Committee (MPC) raised the Central Bank Rate (CBR) to 6.25%, from 5.75%, to contain inflationary pressures.
Private sector credit expanded 31.2%, while foreign exchange reserves stood at USD 6,199.6 million, covering 4.8 months of imports.
The current account deficit widened 21.3% to USD 2,395.3 million as import growth outpaced export gains.
Table of Contents
Inflation
Annual headline inflation rose to 4.2% in July 2026, from 4% in June 2026 and 3.3% in July 2025.
The increase was driven mainly by the pass-through of fuel prices to transport costs.
Inflation remained within the national target and the East African Community (EAC) and Southern African Development Community (SADC) convergence benchmarks.
Core inflation, which excludes unprocessed food and energy, rose to 3.9% from 3.7% in June 2026 and 1.9% in July 2025.
Core inflation remained the largest contributor to the headline rate, accounting for 2.9 percentage points.
Annual food inflation held at 4.1% in July 2026, unchanged from June 2026 and down from 7.6% in July 2025.
The stability reflected increased food availability from the ongoing harvest, with wholesale prices of maize, rice, beans and finger millet all lower than in July 2025.
Energy, fuel and utilities inflation rose to 6.9%, from 6.3% in June 2026 and 1.0% in July 2025, driven mainly by higher kerosene prices.
National Food Reserve Agency stocks stood at 479,065 tonnes, well above the 150,000-tonne benchmark, after the release of 3,008.5 tonnes of maize and paddy to traders.
Monetary Policy
The MPC raised the CBR from 5.75% to 6.25% for the quarter ending September 2026.
The move aimed to contain emerging inflationary pressures, including potential second-round effects from energy, fertilizer and transport costs.
Operations were adjusted to keep the 7-day interbank cash market rate within 150 basis points on either side of the CBR, a band of 4.75% to 7.75%.
Extended broad money (M3) grew 26.9% in the year ending July 2026, above 25.5% in June 2026.
Private sector credit expanded 31.2%, from 28.1% in June 2026, reflecting robust demand including crop purchases in the harvest season.
Transport and communication recorded the strongest sectoral credit growth at 66%, followed by mining and quarrying at 65.2% and trade at 43.5%.
Personal loans, channelled predominantly to micro, small and medium-sized enterprises, remained the largest share of credit at 34%, followed by trade at 15.4% and agriculture at 14%.
Interest Rates
The overall lending rate eased to 14.85% in July 2026, from 15.22% in June 2026.
Negotiated lending rates for prime borrowers rose to 12.04%, from 11.93%.
The overall time deposit rate increased to 8.78%, from 8.69%, while the negotiated deposit rate eased to 10.99%, from 11.17%.
The spread between one-year lending and deposit rates widened by 54 basis points to 6.20 percentage points, from 5.66 percentage points.
Financial Markets
Government Securities
The Bank conducted two Treasury bill auctions with a combined tender of TZS 580 billion.
Bids amounted to TZS 1,287.6 billion, of which TZS 513.4 billion was accepted.
The weighted average yield on Treasury bills declined to 4.74%, from 4.83% in June 2026.
Three Treasury bond auctions, for 2-year, 10-year and 20-year bonds, carried a combined tender of TZS 684.9 billion.
Bids totalled TZS 1,466.2 billion, of which TZS 641.9 billion was accepted.
The 2-year yield rose to 8.40%, the 10-year to 10.87% and the 20-year to 11.33%, steepening the yield curve.
Interbank Cash Market
Interbank cash market turnover more than doubled to TZS 5,627 billion, from TZS 2,508.7 billion in June 2026.
The 7-day tenor accounted for 47.6% of activity.
The overall interbank rate rose by 57 basis points to 6.57%, from 6.00%.
Interbank Foreign Exchange Market
Turnover in the Interbank Foreign Exchange Market (IFEM) increased to USD 227.1 million, from USD 193.3 million in June 2026.
The Bank conducted net sales of USD 110.3 million to mitigate undue volatility.
The Shilling depreciated 0.8% month-on-month, averaging TZS 2,653.52 per USD against TZS 2,633.73 in June 2026.
On an annual basis, the Shilling appreciated 0.5%, reversing a 0.11% depreciation in July 2025.
Government Budgetary Operations
Government revenue exceeded the monthly target by 5.4% in June 2026, totalling TZS 4,658.2 billion.
Central government revenue reached TZS 4,512.1 billion, 96.9% of the total.
Tax revenue was TZS 3,733.2 billion, 12.5% above target.
Non-tax revenue stood at TZS 778.9 billion, below the target of TZS 953.8 billion.
Total expenditure reached TZS 4,720.0 billion, comprising TZS 2,797.9 billion in recurrent spending and TZS 1,922.1 billion in development spending.
Debt Developments
The national debt stock stood at USD 50,782.1 million at end-July 2026, a 0.07% decrease on the previous month, with external debt accounting for 70.7%.
External Debt
External debt stock (public and private) rose 0.2% to USD 35,885.6 million, of which 83.7% was public.
External loan disbursements totalled USD 42.3 million, mainly to the central government.
External debt service payments were USD 122.0 million, including USD 100.7 million in principal repayments.
Multilateral institutions remained the largest creditor category at 59.2%, followed by commercial lenders.
The US Dollar dominated the currency composition at 65.3%, followed by the Euro.
Domestic Debt
Domestic debt rose to TZS 39,472.2 billion at end-July 2026, from TZS 39,325.8 billion the previous month, mainly on government bond issuance.
The Government mobilised TZS 681.4 billion through securities, comprising TZS 502.5 billion in Treasury bonds and TZS 178.9 billion in Treasury bills.
Domestic debt servicing totalled TZS 566.4 billion, including TZS 207.6 billion in principal and TZS 358.8 billion in interest.
External Sector Performance
Current Account
The current account deficit widened 21.3% to USD 2,395.3 million in the year ending July 2026, from USD 1,975.4 million a year earlier.
The widening reflected a USD 3,018.0 million rise in goods imports that outweighed a USD 2,828.3 million increase in exports.
Exports
Total exports of goods and services grew 16.5% to USD 19,985.8 million, led by goods exports and transport receipts.
Goods exports rose 20.7% to USD 11,951.7 million, on higher gold, manufactured goods, tobacco and coffee.
Gold exports increased 37.4% to USD 5,670.7 million on favourable international prices, accounting for 47.4% of goods export earnings.
Manufactured exports grew 46.0% to USD 2,215.5 million, supported by iron and steel products, glassware, and textiles.
Traditional exports rose 14.9% to USD 1,628.8 million, with tobacco at USD 588.6 million, cashew nuts at USD 479.3 million, and coffee at USD 396.0 million.
Service receipts increased to USD 8,034.1 million from USD 7,257.3 million, driven by travel and transport. Travel receipts rose 1.6% to USD 4,292.8 million.
Transport receipts increased 29.7% to USD 3,221.5 million, reflecting higher freight earnings on increased transit cargo volumes.
Imports
Imports of goods and services increased 18.3% to USD 20,807.4 million, led by capital goods, industrial supplies and refined petroleum products.
Goods imports rose to USD 17,439.3 million, from USD 14,421.3 million.
Refined white petroleum products, 18.9% of the goods import bill, increased 42.3% to USD 3,296.8 million.
Services payments increased to USD 3,368.1 million, from USD 3,162.6 million, mainly on higher freight costs.
The primary income deficit narrowed to USD 1,958.4 million, from USD 2,015.5 million.
The secondary income surplus declined to USD 384.7 million, from USD 466.4 million, largely on lower personal transfers.
Foreign Exchange Reserves
Gross official foreign exchange reserves stood at USD 6,199.6 million at end-July 2026, broadly unchanged from a year earlier.
This covered 4.8 months of projected imports, consistent with national and EAC benchmarks.
Want to know more about Trade in Tanzania? Our free overview of the Tanzania Business and Investment Guide 2026 covers Trade, plus key sectors and investment opportunities. The complete 141-page edition includes policies, taxation, key regulations, full macroeconomic data, and sources, and is also available at no cost upon completion of a short form.
Download Free OverviewGet the Full Edition for Free